Data Sources
SentriKat reads public vulnerability data, keeps it up to date on a schedule, and tells you when a source stops answering. This page is about running that: what syncs, when, how to check it, and what to do when something is stale.
The list of sources, who publishes each one and the credit each is owed is at sentrikat.com/third-party-data.
What syncs, and when
| Task | Frequency | What it does |
|---|---|---|
| Exploited vulnerabilities | Daily | Downloads the full catalogue and matches it against your inventory |
| European database | Daily | EU exploited vulnerabilities and severity scores |
| Vendor advisories | Daily | Package advisories plus the Red Hat, Microsoft and Debian feeds |
| Exploit probability | Daily | Probability predictions per CVE |
| Software identity catalogue | Weekly | Vendor and product names used for matching |
| Source health | Every 6h | Probes the upstream feeds |
| License heartbeat | Every 12h | License check and config updates |
The license heartbeat is non-blocking. Air-gapped installations run normally without it, because the license is signed offline and valid for its full term.
Checking source health
Settings → Sync & Updates, in the Data Status block. One row per dataset, and each row answers the only two questions worth asking.
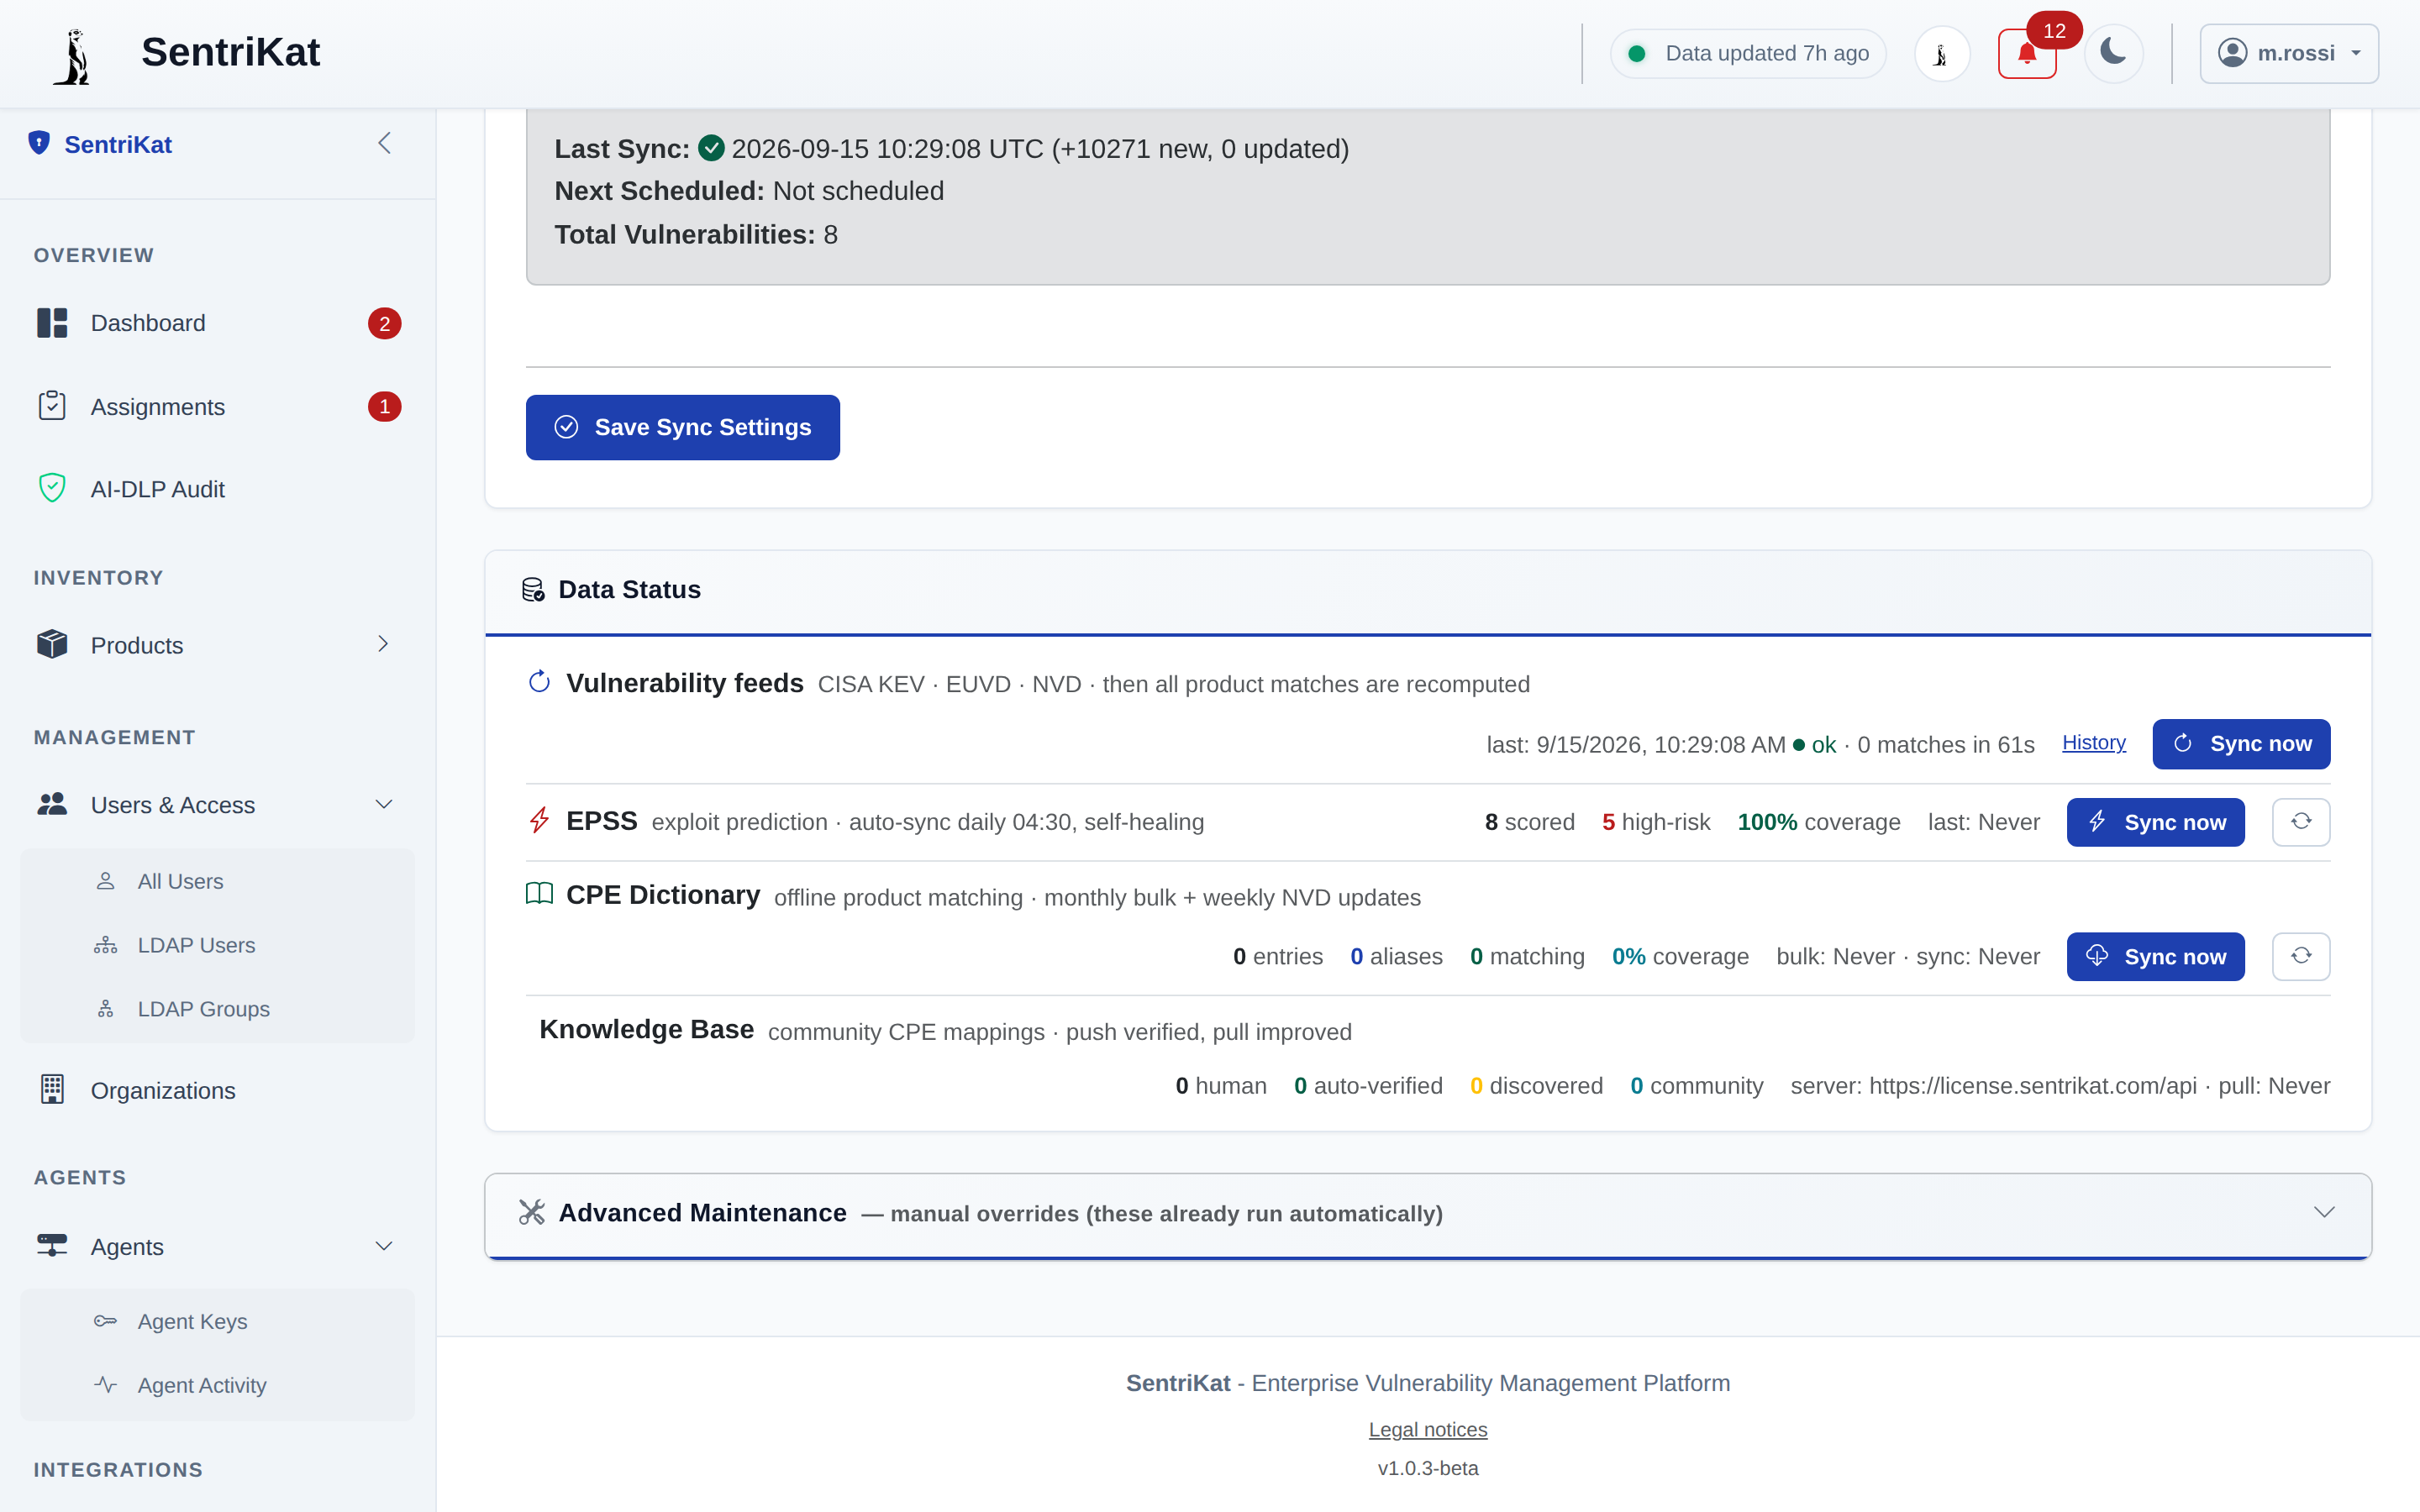
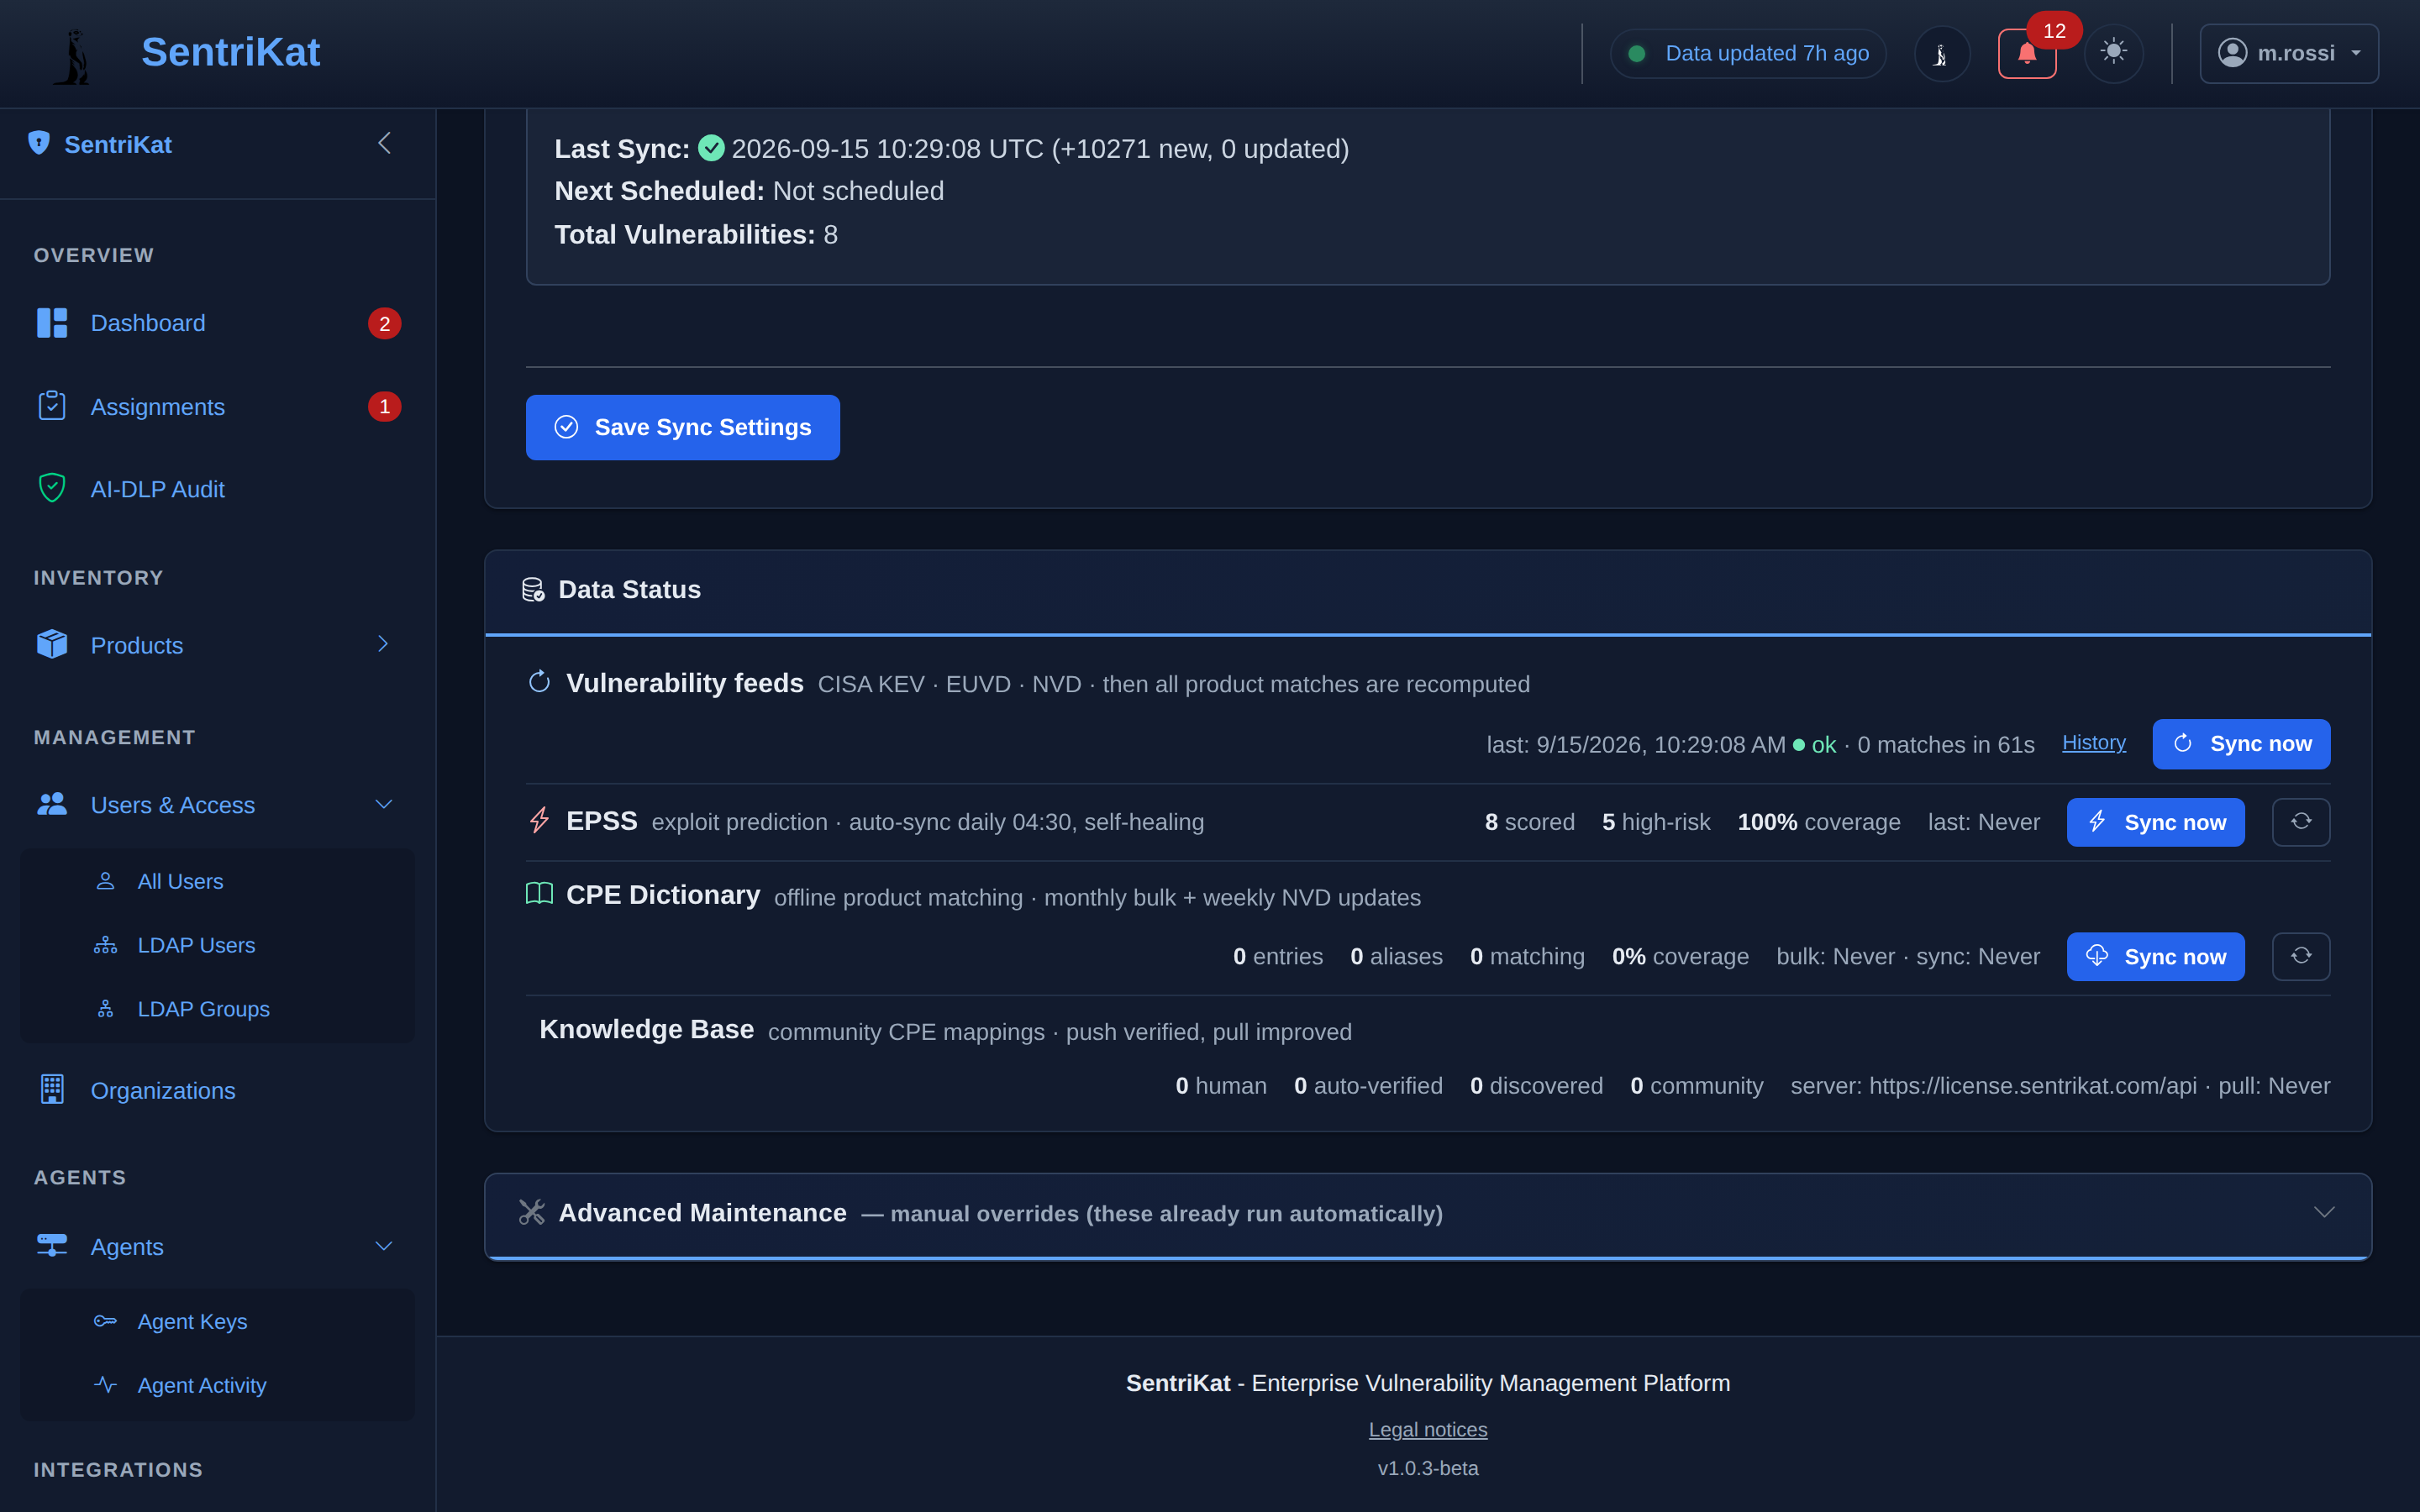
A row reads like this:
last: 9/15/2026, 10:29:08 AM · ok · 0 matches in 61s
| the piece | the question it answers |
|---|---|
last: and the time | did the job run, and how long ago |
ok | did it finish without an error |
the counts (matches, scored, entries, coverage) | did anything actually arrive |
History | the same two answers for the previous runs |
Sync now | run it immediately instead of waiting for the schedule |
Those first and third rows are not the same question, and this is the part worth reading twice: a row can say ok and still bring nothing new.
%%{init: {"flowchart": {"curve": "basis", "nodeSpacing": 45, "rankSpacing": 65, "wrappingWidth": 420}}}%%
flowchart TB
    riga["<b>last: 9/15/2026, 10:29:08 AM · ok · 0 matches in 61s</b>"]

    riga --> q1{"is <b>last:</b> recent,<br/>and does it say <b>ok</b>?"}
    q1 -->|no| j1["<b>The job is not running</b><br/>or it is failing.<br/>Start with the logs below"]
    q1 -->|yes| q2{"are the counts<br/>moving, run after run?"}
    q2 -->|yes| fine["<b>Nothing to do</b>"]
    q2 -->|no| q3{"has it been longer than<br/>the budget for that dataset?"}
    q3 -->|no| normale["<b>Normal</b><br/>a quiet day upstream<br/>is not a fault"]
    q3 -->|yes| guarda["<b>This is the one to look at.</b><br/>The job runs and finishes, and nothing<br/>new is being written, so the fault sits<br/>between the two."]

    classDef act stroke:#3e6b8a,stroke-width:2.5px
    class guarda act
If a row's last: never moves, look for the sync round in the logs:
No lines means the scheduler is not running.
The four-state card is a different screen
If you have read about sources being Healthy, Degraded, Down, Not measured or Probe off, that is the operator console we run on our side, watching the upstream feeds for everybody. Your instance does not have those states: it has the rows above.
The staleness budgets
How long each dataset may go without anything new before it is called stale. The numbers are not derived from how often the job runs: they are statements about how often that kind of data is actually published.
These are the thresholds the feed service uses on our side. Your instance does not show them: it shows the last: time, and this table is how you tell a quiet day from a stopped one.
| Dataset | Budget | Why that number |
|---|---|---|
| Vulnerability records | 48h | New records and revisions appear every day |
| What is affected by what | 48h | Applicability is filled continuously; two days of silence means the fill has stopped |
| Exploit probability | 48h | Recomputed daily upstream, applied hourly here |
| Package advisories | 48h | A full re-sync every day across eight ecosystems |
| Distribution advisories | 72h | They publish on working days, so a long weekend is normal and 48h would cry wolf every Easter |
| Software identity catalogue | 240h | A weekly job against a dictionary that is revised slowly |
| Exploited-in-the-wild signals | 6h | Judged by whether the job ran, not by whether the rows moved. See below |
The last row is the exception. That dataset is small and changes rarely: a handful of new entries in a week, and sometimes none for days. Asking "when did a row last change" would call a perfectly healthy dataset dead after a quiet week, so this one is judged by whether the job that maintains it ran recently instead. Different question, different answer, and it is the reason the number is 6 and not 48.
One dataset has no staleness alarm at all, on purpose: the log of transitions in and out of the exploited catalogue. Entries arrive in irregular batches and a fortnight of silence is normal, so an alarm there would be wrong most of the time, and an alarm that is usually wrong is one people learn to close. Whether the job behind it still runs is checked separately, and that one does fire.
Alerts
When a source changes, administrators are notified by email with which source changed, what changed, the old and new values, and what to do about it.
Set the recipient in your .env:
Air-gapped installations
Air-gapped installations do not reach these feeds. Import the signed offline bundle instead, from Settings → Sync & Updates. The bundle carries the same data and is verified against its signature before anything is written.
API
These routes are on the license server, not on your installation. The base URL is https://portal.sentrikat.com.
# Current status of all sources
GET /api/v1/admin/datasources/status
Authorization: Bearer <admin-api-key>

# Health check history for one source
GET /api/v1/admin/datasources/history?source=nvd&limit=50
Authorization: Bearer <admin-api-key>

# Trigger a probe now
POST /api/v1/admin/datasources/probe?source=nvd
Authorization: Bearer <admin-api-key>
source takes the internal identifier of a feed, which is what the status endpoint returns for each one.