Dashboard
The dashboard provides an at-a-glance view of your organization's vulnerability posture.
Overview
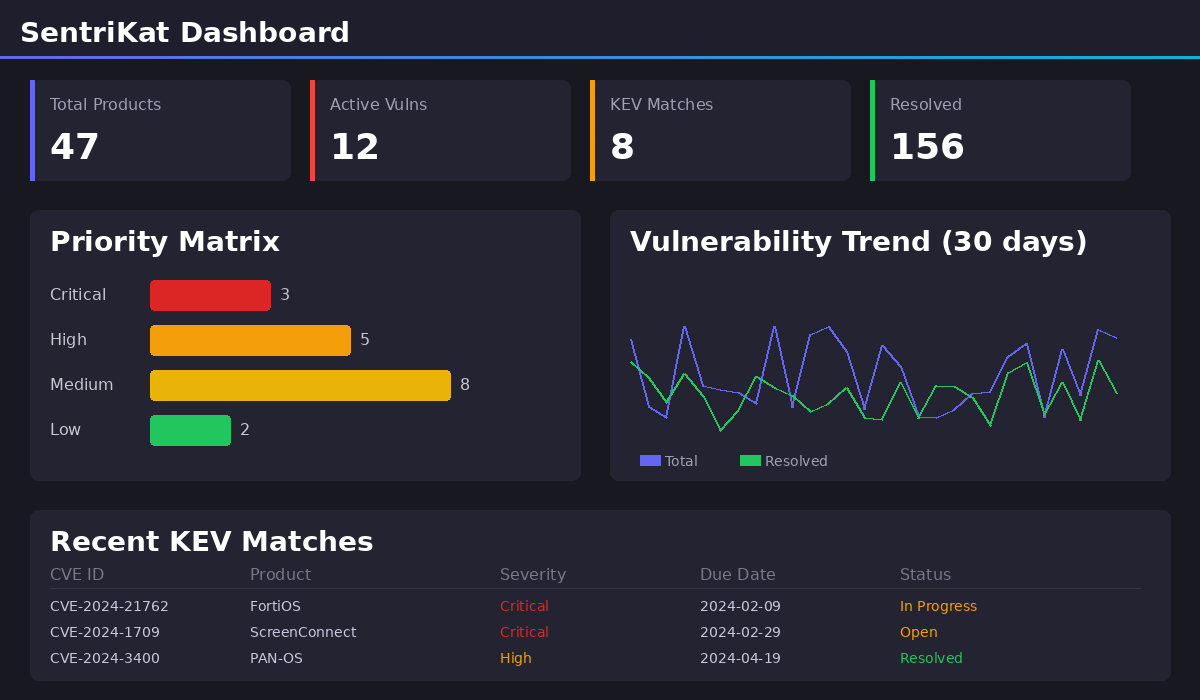
The dashboard displays:
- Priority Matrix - Vulnerabilities grouped by severity
- Trend Chart - Historical vulnerability counts
- Recent Matches - Latest vulnerability discoveries
- Quick Stats - Key metrics
Priority Matrix
The priority matrix shows active (unacknowledged) vulnerabilities:
| Color | Priority | Criteria |
|---|---|---|
| Red | Critical | Ransomware OR due ≤7 days |
| Orange | High | CVSS ≥9 OR due ≤30 days |
| Yellow | Medium | CVSS ≥7 |
| Green | Low | Other KEV entries |
Click any cell to view details.
Filtering
Filter the dashboard by:
- Organization - Select specific org (multi-tenant)
- Key Type - Toggle between Server, Client, or All to view vulnerabilities by infrastructure type. This maps to the key type assigned to each agent's API key (see Agent API Keys)
- Date Range - View specific time period
- Priority - Focus on specific severity
- Status - Acknowledged vs unacknowledged
Trend Chart
The trend chart shows:
- Total vulnerabilities over time
- New discoveries per day/week
- Resolution rate
Hover over data points for details.
Sharing
Share a filtered view with stakeholders:
- Configure your filters
- Click Share button
- Copy the generated link
- Recipients can view without logging in
Share Expiration
Shared links expire after 30 days by default.
Export
Export dashboard data:
- Configure filters
- Click Export
- Choose format:
- CSV - Raw data
- PDF - Formatted report
- JSON - API-compatible
Customization
Default Filters
Set your default dashboard view:
- Go to Settings → Preferences
- Configure default filters
- Save
Refresh Interval
The dashboard auto-refreshes every 5 minutes. Change this:
- Click the refresh icon
- Select interval (1, 5, 15, 30 minutes)